
TESTING METHODOLOGY
The methodology of the P3 connect Mobile Benchmark is the result of P3’s many years of experience. It was carefully designed to evaluate and objectively compare the performance and service quality of Australia’s mobile networks from the users’ perspective.
The P3 connect Mobile Benchmark in Australia took place from October 11th to October 24th, 2017. All samples were collected between 8 am and 10 pm. The network tests covered nine larger cities with more than 100 000 inhabitants each. Additionally, our test routes led through 19 smaller towns as well as the connecting roads between them. This combination of test areas had been carefully selected to provide a significant series of test results covering the Australian population. The areas chosen for the 2017 test account for approximately 13.7 million people, or 61 per cent of the total Australian population.
P3 conducted the tests with four drive-test cars, equipped with arrays of Samsung Galaxy S7 Cat 9 smartphones for the simultaneous measurement of cellular voice and cellular data services. Additionally, two teams conducted walktests in four large Australian cities.
Voice testing
Two smartphones per operator in each car were used for the voice tests, resulting in a total of six voice test devices per car or 24 devices in total. The walktest teams also carried two smartphones per operator in their backpacks. All phones were constantly setting up test calls between each other – from car to car and from each walking staff member to a stationary counterpart. The audio quality of the transmitted speech samples was evaluated using the HD-voice capable and ITU standardized so-called POLQA wideband algorithm. All Australian operators offer 4G capable subscriptions. To take the high share of LTE offerings into account, speech samples were acquired partly in 4G preferred to 3G preferred mode and partly in 4G preferred to 4G preferred mode. As a consequence, in 4G networks with VoLTE support, the phones would prefer this voice mode. If 4G (or VoLTE respectively) was not available, they would need to to switch (“fall back”) to 2G or 3G for the voice calls (so called “circuit-switched fall back“ or CSFB).
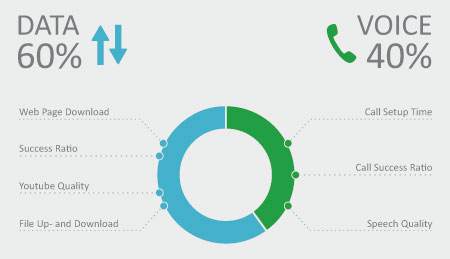
In order to account for typical smartphone use scenarios during the voice tests, background data traffic was generated in a controlled way through random injection of small amounts of HTTP traffic. The voice test scores account for 40 per cent of the total benchmark results.
Data testing
Data performance was measured using one additional Samsung Galaxy S7 per operator in each car – resulting in three more smartphones per car or a total of 12 devices in total for the data drivetest. For the data walktests, each of the two teams carried one Galaxy S7 per operator. So, in total, the drivetest cars carried 12 devices for the data tests and the walktest teams carried six devices for the data tests. For all of them, the radio access technology was set to LTE preferred mode.
The web tests accessed the ten most popular web pages in Australia according to the widely recognized Alexa ranking. In addition, the static “Kepler” test web page as specified by ETSI (European Telecommunications Standards Institute) was used. In order to test the data service performance, files of 3MB and 1MB for download and upload respectively were transferred from or to a test server located on the Internet. Furthermore, the peak data performance was tested in uplink and downlink directions by assessing the amount of data that was transferred within a seven seconds time period.
Another discipline was the playback of Youtube videos. It took into account that Youtube dynamically adapts the video resolution to the available bandwidth. So, in addition to success ratios, start times and playouts without interruptions, Youtube measurements also determined the average video resolution.
All the tests were conducted with the best-performing mobile plan available from each operator. Data scores account for 60 per cent of the total results.
Logistics
The test routes are shown on the map under "Results in a Nutshell". In the 9 big cities and 19 smaller towns, the cars followed predefined routes. Altogether, the four test cars covered approximately 12 400 kilometres, of which approx. 4700 km led through big cities and 1300 km through the smaller towns, while 6400 km were covered on connecting roads and crossing the Outback. In order to cover both the east and the west coast, the drivetest teams flew from Brisbane to Perth, subsequently taking cars from there which also carried the measurement equipment.
During all of the drivetests, two cars were present in the same cities, but on different routes to avoid any interference of one car’s measurement by the other car’s.
The walktests were conducted in four large Australian cities. For this effort, the teams measured in so-called “areas of interest“ with a distinctive user frequency like central business districts, selected tourist hotspots and major shopping malls in Sydney, Melbourne, Brisbane and Adelaide. The teams even tested on public transport in each city, such as buses or metro train lines.
Performance indicators and rating
The score weighting reflects both the geographical distribution of Australia‘s population and the ranking of usage scenarios. Therefore, 600 of the total of 1000 maximum points were assigned to the cities – 240 maximum points refer to the voice results and 360 maximum points reflect the data results. For the towns and the roads, a maximum of 200 points each is available. In both categories, the possible maximum is 80 points in the voice, and 120 points in the data category. The score breakdown shown below depicts the distribution of the maximum points over all the drivetest and walktest categories. In the table below, you can find the percentage of maximum points that each operator has achieved in each discipline.
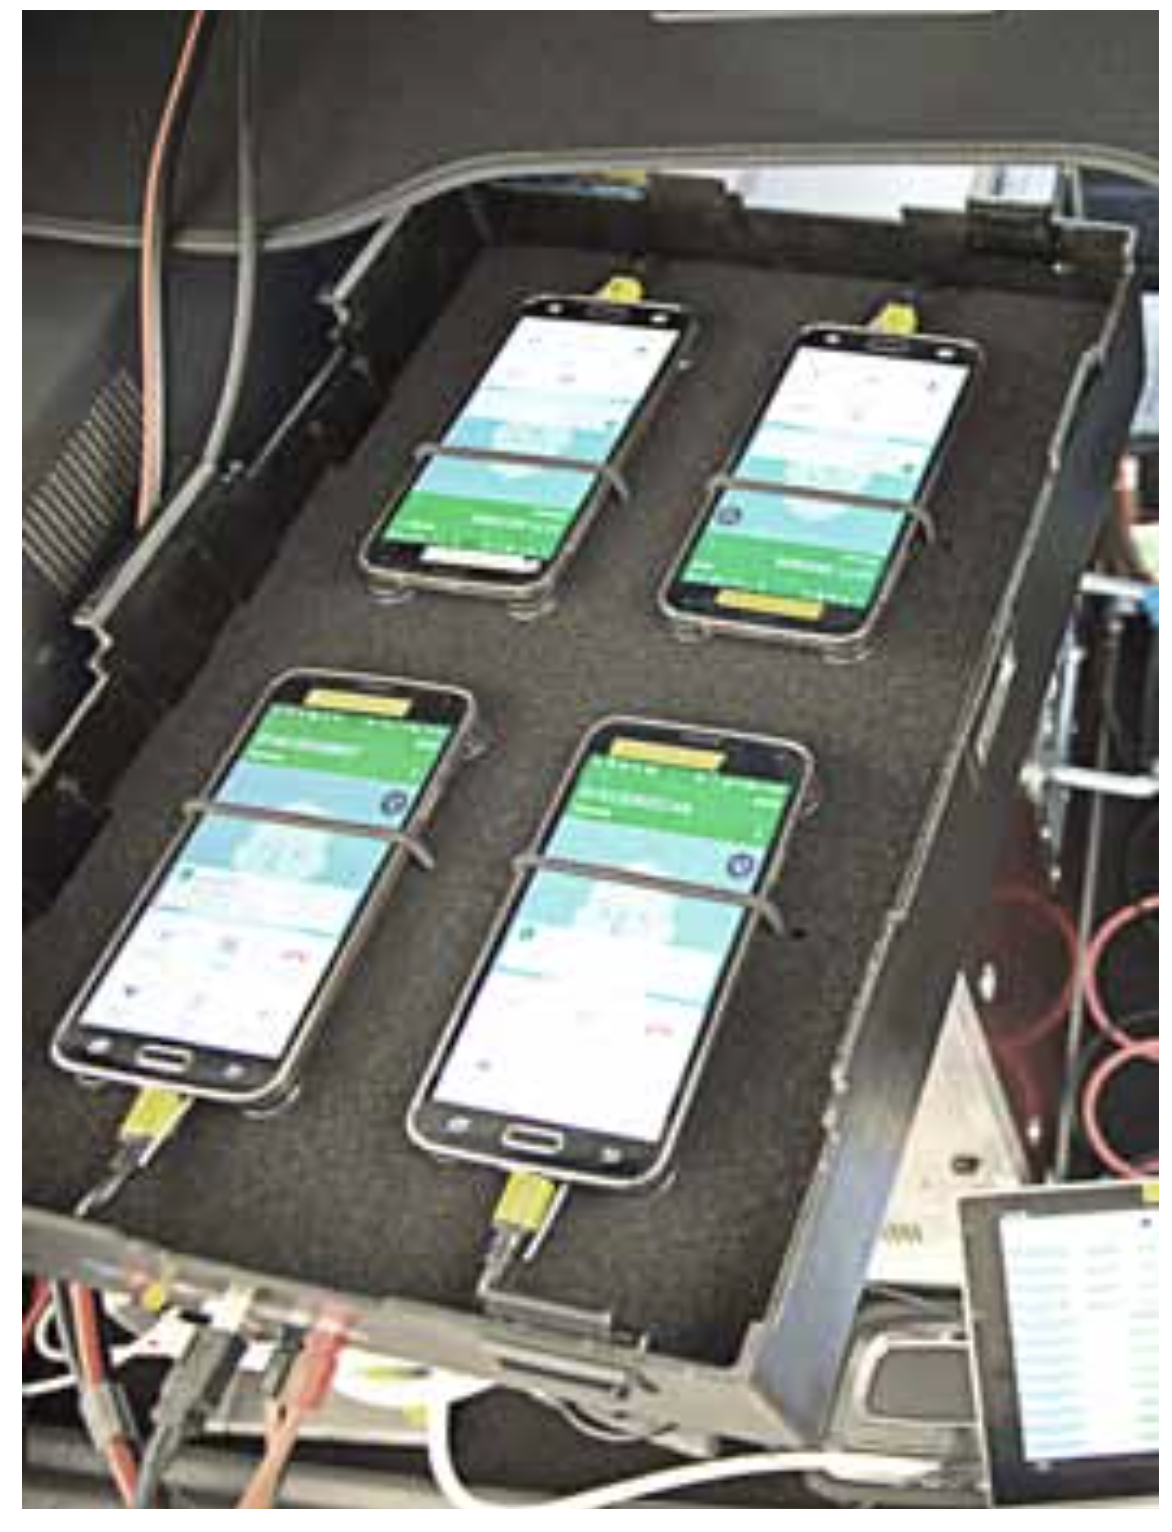
Each car carried a total of nine smartphones, housed in separate boxes – six per car were used for the voice tests and three additional ones for the data tests. Altogether, 36 devices were used in the drivetests.
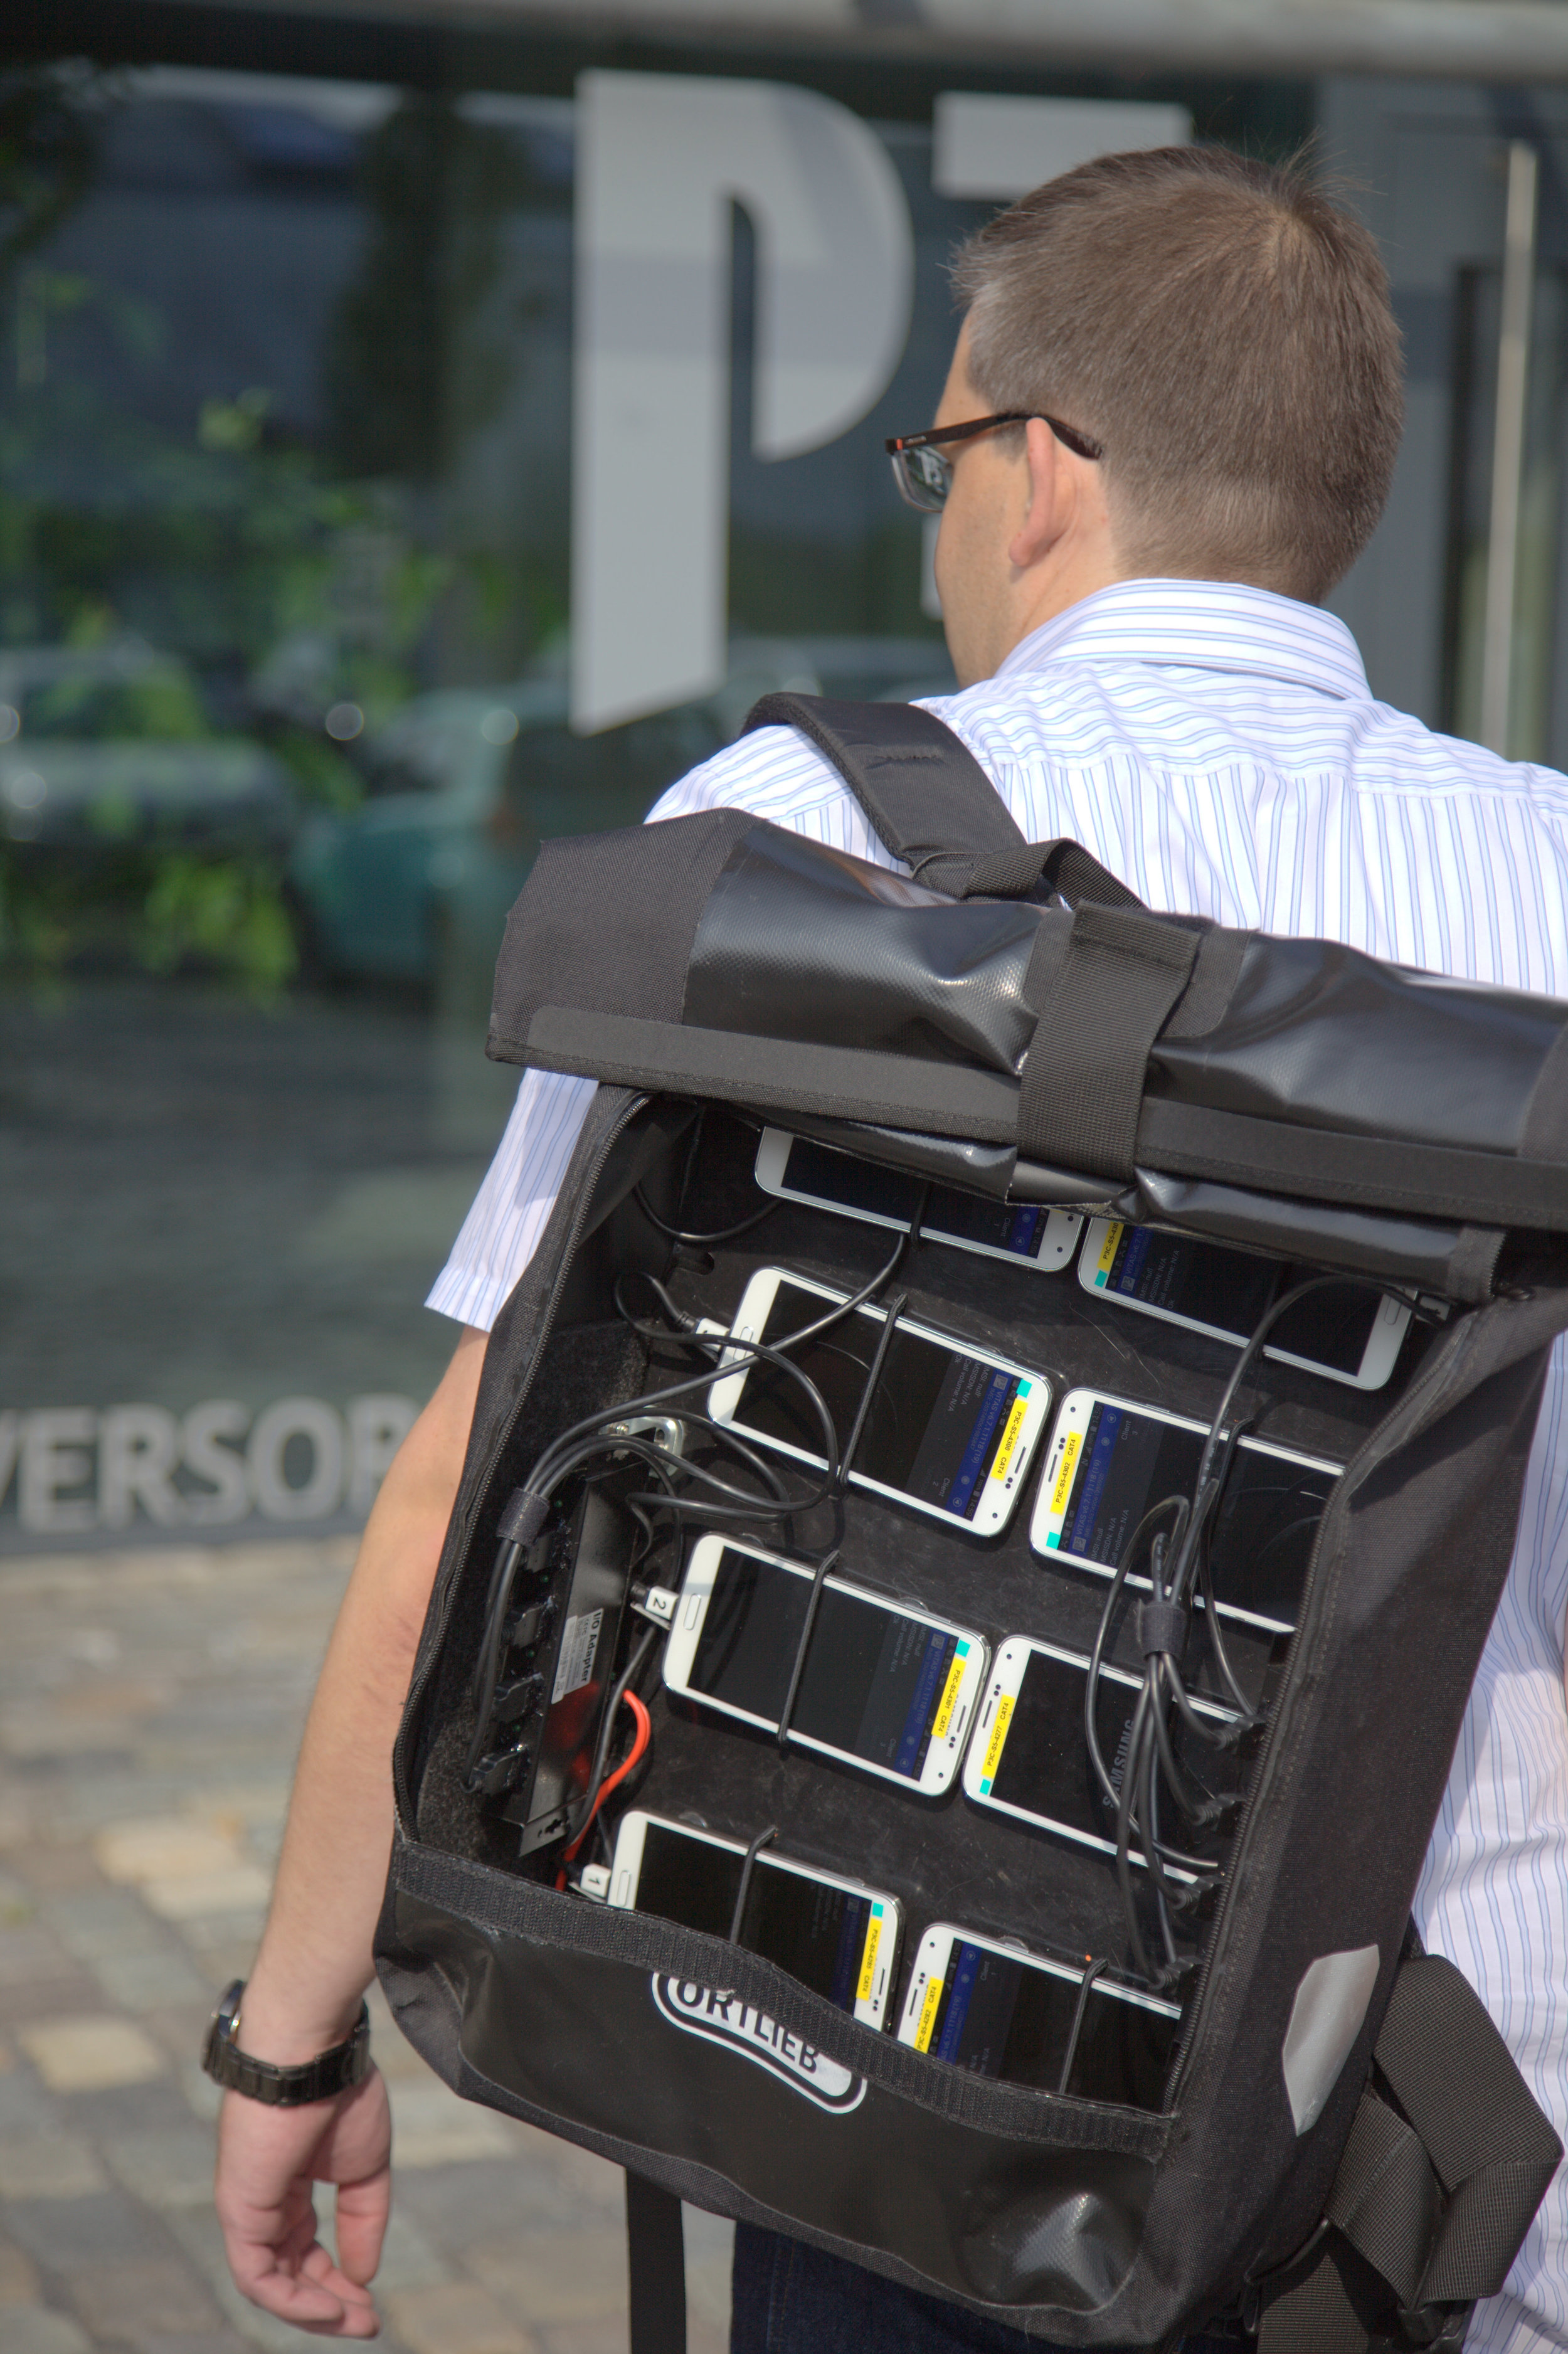
For the walktests, each team member carried the same number of smartphones in their backpacks as in the cars (six for voice and three for data). Altogether, 18 additional smartphones were used in the walktests.
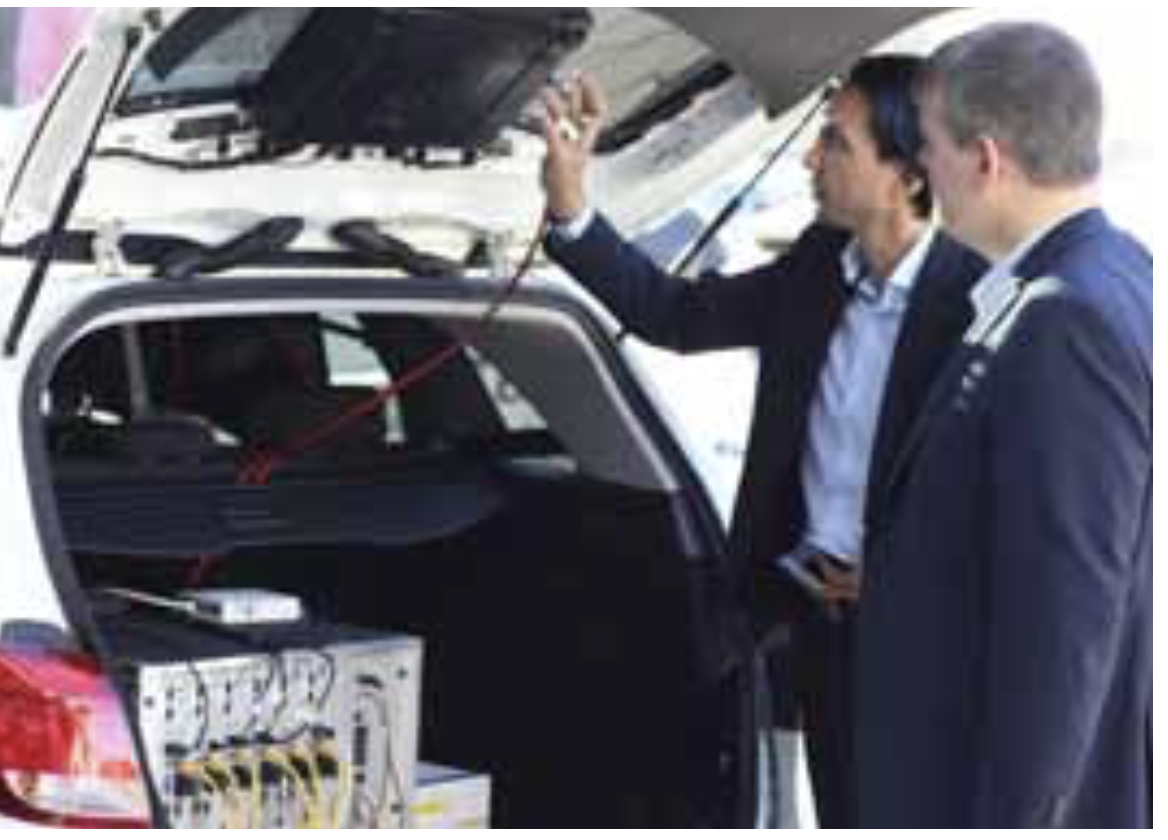
Hakan Ekmen, Managing Director of P3 and Bernd Theiss, Head of connect’s test lab, inspect the testing equipment.

ConclusioN
All three Australian operators have improved their scores over last year. Overall winner Optus overtakes an also “very good“ Telstra by just three points. Vodafone confirms its position and receives the grade “good“.
The two largest Australian operators Telstra and Optus fought a close race for the top rank in this year‘s mobile benchmark in Australia. With a narrow margin of three points, the overall winner is Optus. This operator gains the victory due to strong results in the voice displine. Like Optus, also the second ranking Telstra receives the grade “very good“. Telstra scores somewhat stronger in the data discipline but falls a little behind Optus in the voice category.
Vodafone comes in third regarding the overall ranking as well as in both the single voice and data rankings. In the bigger cities, this operator holds up well with the top two. In the Australian metropolises, each of the three contenders achieved compelling results. However, Vodafone performs a little more limited in smaller towns and particularly on the connecting roads.
In fact, all three Australian operators managed to improve over their scores from last year‘s benchmark. Optus has made the biggest leap (+50 points), landing right at the top rank. Telstra improves by 17 points, which is also a pleasant result but was just not enough to keep Optus from taking over. Vodafone improves by five points, holding its position in the overall evaluation.
All three operators strong in cities, advantages for Optus and Telstra in towns and particularly on roads
As was to be expected, the performance levels of all three contenders drop in smaller towns and on the connecting roads. Even in these scenarios, the two top dogs Optus and Telstra score closely together while Vodafone falls distinctly behind. It is here, outside of the big cities, that the overall result is ultimately constituted. While all three operators are very strong in urban areas, in more rural regions, Optus and Telstra offer clear advantages.


A leap of 50 points in comparison to last year’s result is an impressive advancement and secures Optus the overall win in this test. The decisive factor is Optus’ strong performance in the voice discipline. But the operator also improved in the data category, achieving strong results there too. Congratulations to the winner!


Australia’s market leader in terms of subscriber numbers, also improved distinctly over last year’s results, but is closely beaten by Optus. However, Telstra is the stron-gest Australian contender in the data category and also shows very good voice results. When it comes to data connectivity on the roads, Telstra achieves the best score.

The smallest Australian provider holds up very well in the voice and data test conducted in the big cities and with minor restrictions also in the smaller towns. In some cities like Adelaide and Perth, Vodafone scored ahead of its competitors. Some weaknesses can be seen in both the voice and the data disciplines on connecting roads.