
TESTING METHODOLOGY
THE METHODOLOGY OF THE P3 CONNECT MOBILE BENCHMARK IS THE RESULT OF MORE THAN 15 YEARS OF TESTING MOBILE NETWORKS. TODAY, NETWORK TESTS ARE CONDUCTED IN MORE THAN 80 COUNTRIES. OUR METHODOLOGY WAS CAREFULLY DESIGNED TO EVALUATE AND OBJECTIVELY COMPARE THE PERFORMANCE AND SERVICE QUALITY OF MOBILE NETWORKS FROM THE USERS’ PERSPECTIVE.
The P3 connect Mobile Benchmark in Sweden comprises of the results of extensive voice and data drivetests and walktests as well as a sophisticated crowdsourcing approach.
DRIVETESTS AND WALKTESTS
The drivetests and walktests in Sweden took place from February 21 to March 23, 2019. All samples were collected during the day, between 8.00 am and 10.00 pm. The network tests covered inner-city, outer metropolitan and suburban areas. Measurements were also taken in smaller towns and on the connecting highways. The two measurement cars together covered about 3,320 kilometres in the cities, about 680 km in towns and about 6,500 km on the roads – resulting in a total of 10,500 kilometres. The combination of test areas has been selected to provide representative test results across the Swedish population. The areas selected for the 2019 test account for approximately 4.3 million people, or roughly 43.9 per cent of the total population of Sweden.
The drivetests covered 20 cities and 27 towns. Additionally, one team conducted walktests in eight cities. The exact routes are shown here, all visited cities and towns are listed in the box below.

The two drive-test cars as well as the battery-powered backpacks of the walktest teams were equipped with arrays of Samsung Galaxy S9 smartphones for the simultaneous measurement of voice and data services.
VOICE TESTING
One smartphone per operator in each car was used for the voice tests, setting up test calls from one car to another. The walktest team also carried one smartphone per operator for the voice tests. In this case, the smartphones called a stationary counterpart.The audio quality of the calls was evaluated using the HD-voice capable and ITU standardised POLQA wideband algorithm.
All smartphones used for the voice tests were set to VoLTE preferred mode. In networks or areas where this modern 4G-based voice technology was not available, they would perform a so-called circuit-switched fallback (CSFB) to 3G or 2G.
As a new KPI in 2018, we assess the so-called P90 value for call setup times. P90 values specify the threshold in a statistical distribution, below which 90 per cent of the gathered values are ranging.
In order to account for typical smartphone use during the voice tests, background data traffic was generated through random injection of small amounts of HTTP traffic. The voice scores account for 34 per cent of the total results.
DATA TESTING
Data performance was measured by using three more Galaxy S9 per car or walktest team – one per operator. Their radio access technology was set to LTE preferred mode.
For the web tests, they accessed web pages according to the widely recognised Alexa ranking. In addition, the static Kepler test web page as specified by ETSI (European Telecommunications Standards Institute) was used. In order to test the data service performance, files of 3 MB and 1 MB for download and upload were transferred from or to a test server located on the internet. In addition, the peak data performance was tested in uplink and downlink directions by assessing the amount of data that was transferred within a seven seconds time period. This KPI targets to show the network capability,
i.e. the maximum achievable data throughput, similar to what speed test apps would show.
The evaluation of Youtube playback takes into account that YouTube dynamically adapts the video resolution to the available bandwidth. So, in addition to success ratios, start times and playouts without interruptions, we also determined average video resolution. All tests were conducted with the best-performing mobile plan of each operator. Data scores account for 51 per cent of the total results.
CROWDSOURCING
Additionally, P3 conducted crowd-based analyses of the Swedish networks which contribute 15 per cent to the end result. They are based on data that were gathered in December 2018 as well as in January and February 2019. For the collection of crowd data, P3 has integrated
background diagnosis processes into 800+ diverse Android apps. If one of these applications is installed on the end user’s phone and the user authorizes the background analysis, data collection takes place 24/7, 365 days a year. Reports are generated for every quarter of an hour and sent daily to P3‘s cloud servers. Such reports contain just a small number of bytes per message and do not include any personal user data.
NETWORK COVERAGE
For the assessment of network coverage, P3 lays a grid of 2 by 2 kilometres over the whole test area. The “evaluation areas“ generated this way are then sub-divided into 16 smaller tiles. To ensure statistical relevance, P3 requires a certain number of users and measurement values per operator for each tile and each evaluation area. If these thresholds are not met by one of the operators, this part of the map will not be considered in the assessment for the sake of fairness.
“Quality of Coverage“ reveals whether voice and data services actually work in an evaluation area. P3 does this because not in each area that allegedly provides network reception, mobile services can actually be used. We specify these values for the coverage of voice services (3G and 4G combined), data (3G and 4G combined) and 4G only.
DATA THROUGHPUTS
purpose, we determine the best obtained data rate for each user during the evaluation period and then calculate their average value. In addition, we determine the so-called P90 values for the top throughput of each evaluation area as well as of each user’s best throughput. P90 values specify the threshold in a statistical distribution, below which 90 per cent of the gathered values are ranging and depict how fast the network is under favourable conditions.
DATA SERVICE AVAILABILITY
Formerly called “operational excellence“, this parameter indicates the number of outages or service degradations – events where data connectivity is impacted by a number of cases that significantly exceeds the expectation level. To judge this, the algorithm looks at a sliding window around the hour of interest. This ensures that we only consider actual degradations as opposed to a simple loss of network coverage due to prolonged indoor stays or similar reasons.
In order to ensure statistical relevance, each operator must have sufficient statistics for trend and noise analyses per each evaluated hour. The exact number depends on market size and the number of operators. A valid assessment month must comprise of at least 90 per cent of valid assessment hours. Deviating from the other crowd score elements, Data Service Availability is rated based on a nine-month observation period – in this case from June 2018 to February 2019.

Two boxes were mounted into the rear and side windows of each measurement car in order to support six smartphones per car.

One Samsung Galaxy S9 per operator took the voice measurements and one additional S9 per operator was used for the data tests.

All test phones were operated and supervised by P3‘s unique control system.


P3 has integrated a background diagnosis processes into 800+ diverse Android apps. If one of these applications is installed on the user’s phone and the user authorizes background analysis, data collection takes place 24/7, 365 days a year.
CONCLUSION
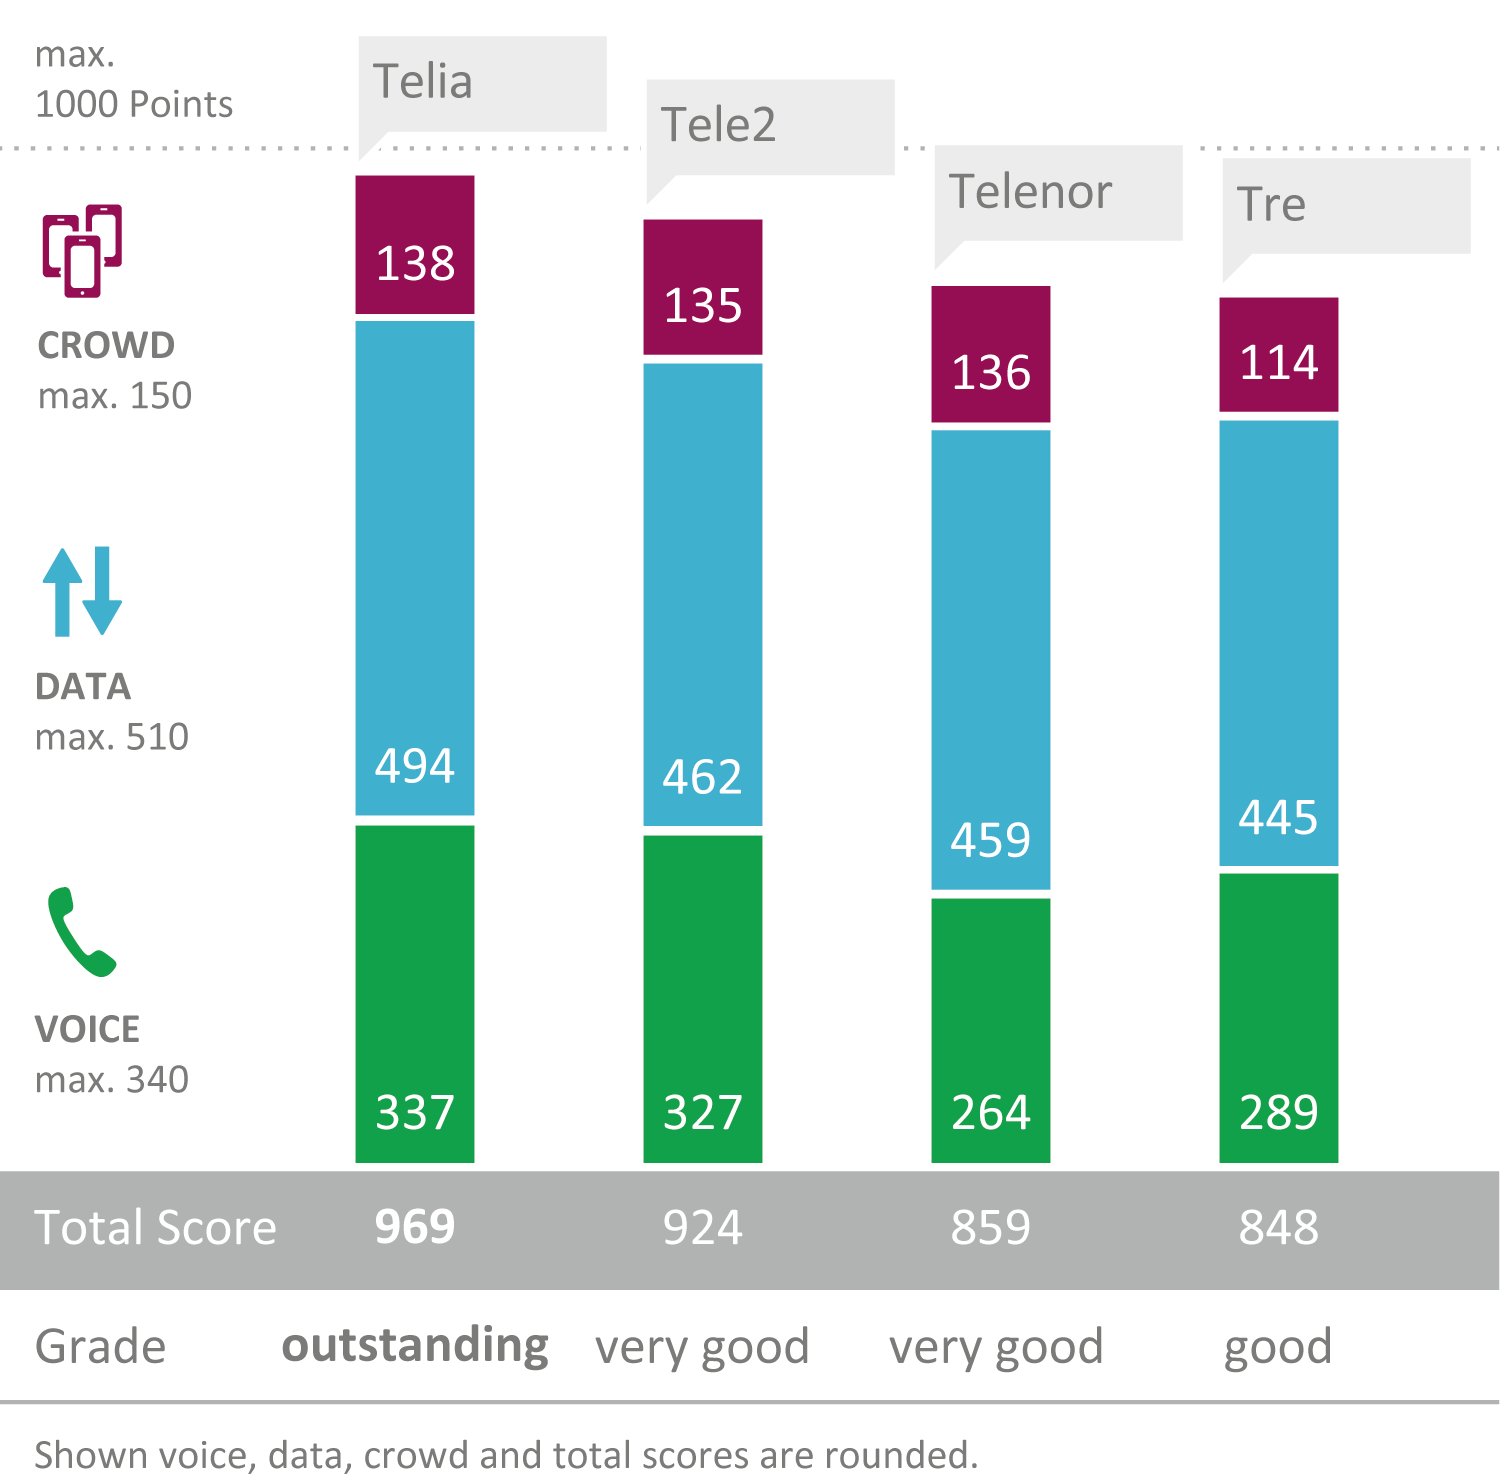
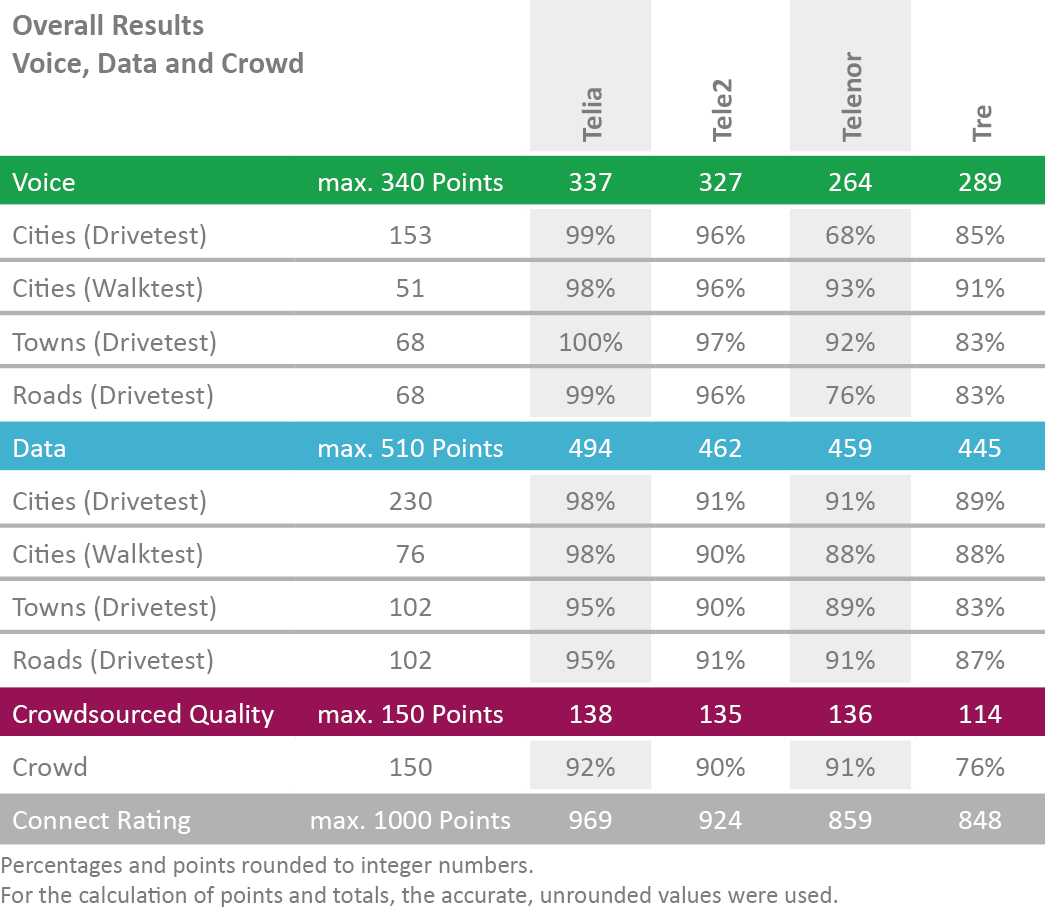
TELIA IS THE OVERALL WINNER – FOR THE THIRD TIME IN A ROW AND WITH THE RARE GRADE “OUTSTANDING”. TELE2, TELENOR AND TRE ACHIEVE SCORE INCREASES AS WELL, WITH TELE2 AND TRE IMPROVING CONSIDERABLY.
Telia wins the P3 connect Mobile Benchmark in Sweden for the third time in a row. The largest Swedish operator achieves the highest score that P3 has determind in Sweden so far – well deserving the grade “outstanding”. In comparison to our previous benchmark in Sweden, Telia shows a significant improvement in the voice rating and a slight increase in the data score.
Tele2 ranks second, showing the biggest score improvement over our previous test. Most of its score increase is won in the voice discipline, but Tele2 also improved in the data measurements. Our crowdsourced assessment of service degradations registered a significant event in Tele2’s network in January 2019.
Telenor ranks third, showing a similar data performance as the second ranking Tele2, but losing valuable points due to limited results in the voice category. Although also improving over the results of our previous benchmark, Telenor’s score increase is less pronounced than those of the other three.
Tre, the smallest Swedish operator, ranks fourth but with overall good results. Compared to our previous test, Tre achieved a considerable score increase.