
METHODOLOGY
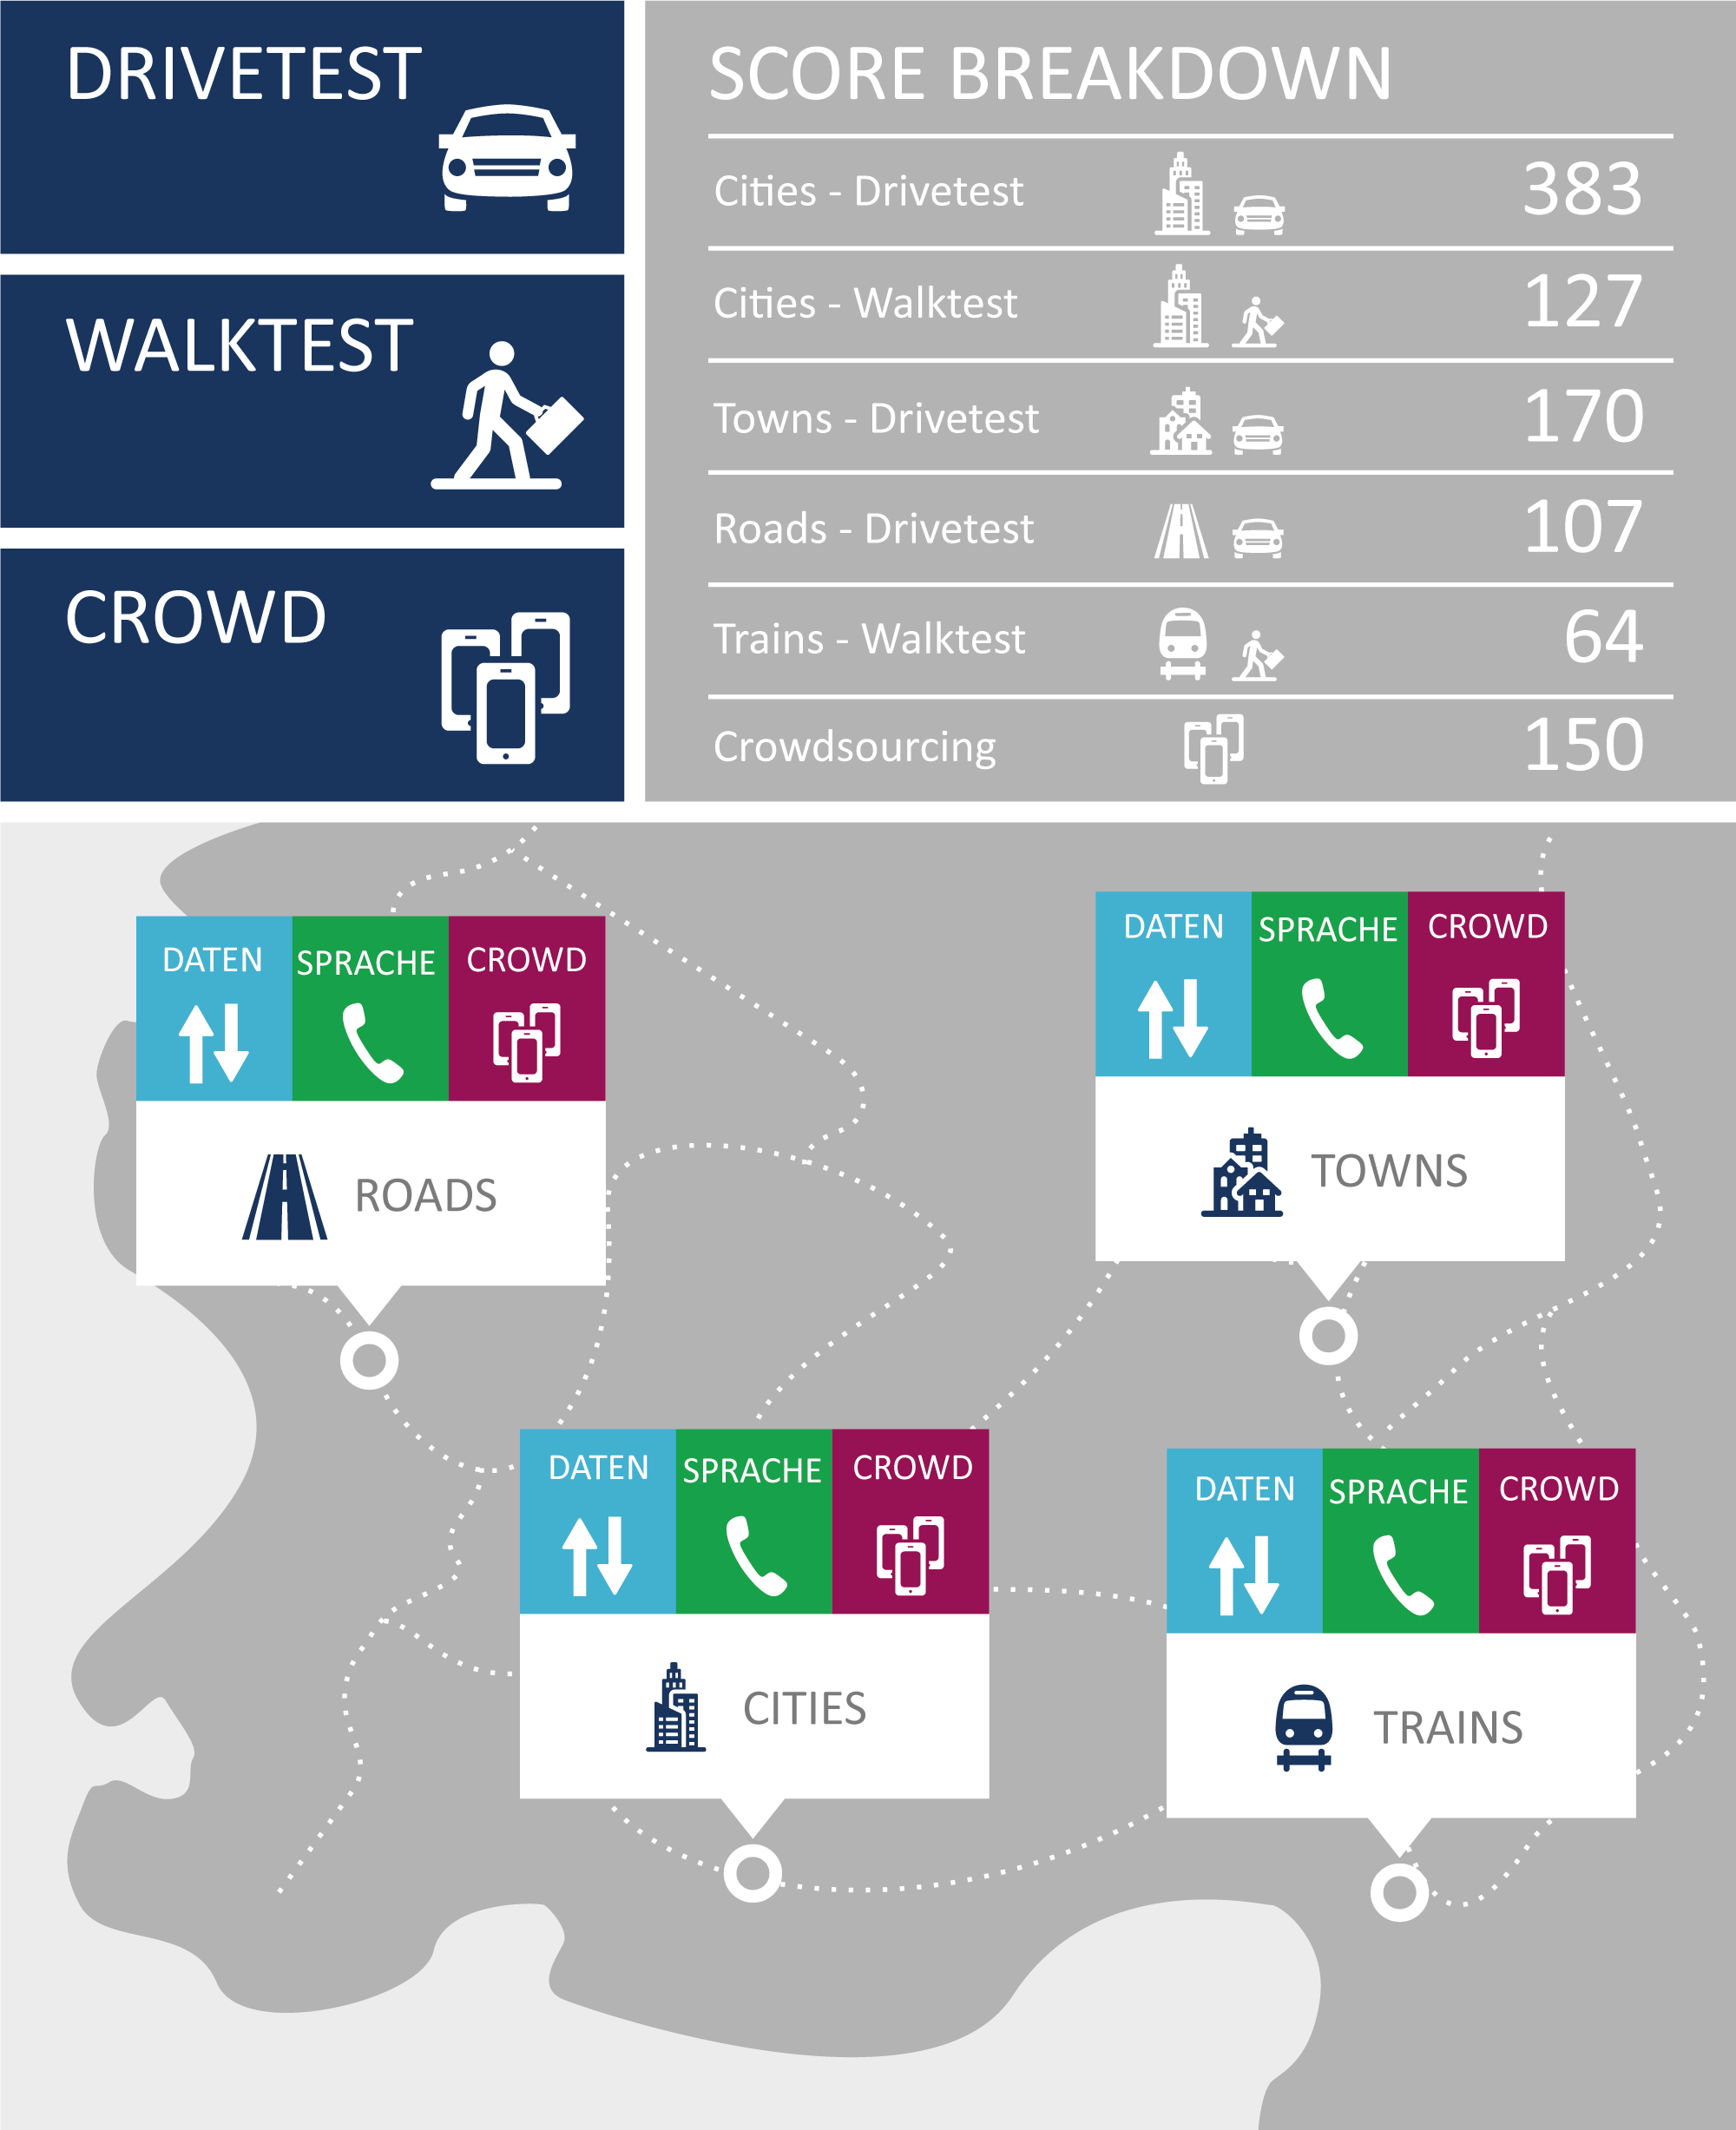
The tests in Switzerland took place from November 28 to December 20, 2018. connect‘s partner for the network measurements, P3, used two vehicles for drivetesting the
chosen cities, towns and roads. Each car carried a total of six Samsung Galaxy S8 smartphones. One per operator was used for the voice tests and another one for the data measurements.
In addition to the drivetest, in each country a walktest team took measurements by foot. For this effort, the teams visited so-called “areas of interest“ with a strong visitor frequency like train stations, airport terminals, coffee shops, museums and also local public transport. Travelling from city to city allowed the assessment of cellular network quality within long distance trains.
The walktest teams also utilised Samsung Galaxy S8 smartphones that were installed in trolleys and back packs with additional strong batteries.
The devices’ firmware was each operator’s current firmware version. If such software was not available, the most current firmware from the smartphone manufacturer was used.
Voice telephony
Voice services were measured with the smartphones performing calls alternating between the measurement cars (“mobile to mobile“). The walktest teams called a stationary counterpart for all voice tests.
Background data traffic was transmitted by one of the smartphones simultaneously to each call in order to reflect a realistic usage scenario. Audio quality was assessed by using the HD-Voice capable POLQA (Perceptual Objective Listening Quality Assessment) wide band scoring.
All devices were configured in “LTE preferred” mode. Thus, they could benefit from the more modern “Voice over LTE“ (VoLTE) whereever this was available.
Data connectivity
To assess cellular data performance, a sequence of tests was executed. As a dynamic web browsing test, each country’s top websites (according to the Alexa ranking) were downloaded in the so-called live webbrowsing test. Additionally a static website was tested, the industry standard ETSI (European Telecommunications Standards Institute) Kepler reference page.
HTTP downloads and uploads were conducted with 3 MB and 1 MB files, simulating small file transfers. The networks’ peak performance was tested with a seven second download and upload of a single, very large file.
The Youtube measurements performed on the smartphones considered the “adaptive resolution“ feature of this video platform. In order to offer a persistent video experience, Youtube adapts the video streams‘ resolution dynamically to the bandwidth that is currently available. Our scoring therefore considers the success ratio, the time until the playback starts, the percentage of video playouts that take place without interruptions as well as the videos‘ average resolution or line number count respectively.
Logistics
All drivetests and walktests were done between 8 am and 10 pm. During the drivetests, two cars were present in the same cities, but on different routes to avoid any interference of one car’s measurement by the other car’s.
On the connecting roads, both vehicles drove a given route, but followed each other at a small temporal and spatial distance. At each location, the test smartphones had to share the networks‘ bandwidth with normal customers. This represents the usual competition for the limited resource of the networks‘ available radio frequencies.
In Switzerland, the measurements included 18 larger cities and 31 smaller towns, while the walktests frequented eight cities. The measurement cars drove a total of approx. 6,500 kilometers. Of these, 3160 km accounted for the connecting roads between the cities and towns. The drivetests and walktests covered about 2.1 million inhabitants which equals about 25.4 per cent of the Swiss population. All in all, a total of 14,887 voice samples und 140,007 data samples was collected.
The definition of the test routes follows a well-defined process: P3 generates four independent and representative city and route plans. The connect editors then randomly choose one of these four alternatives.
Crowdsourcing
The results of the crowdsourcing analyses performed by P3 contribute 15 per cent of the total score. For this purpose, a total of 153 million single measurement values from von 54,000 mobile communications users from September until November 2018 was evaluated. This comprises about 83 per cent of the total built-up area of Switzerland.
The data base for these analyses is obtained by more than 800 popular apps. They log in the background whether there is a network connections, which mobile network technologies are available and what download data rates can be achieved – provided that the user has before agreed to this completely anonymous data collection.
These measurement values are gathered every 15 minutes and transmitted once a day to P3‘s servers. The reports only comprise of a small number of bytes so that they do not put a substantial strain to the users‘ data volumes. Readers who wish to actively support our network test can do this by installing and using the connect app (see box below). However, it is only one of many apps containing the described background functionality.
Network coverage
In order to determine the coverage with 4G, “data“ (3G and 4G) as well as telephony, P3 applies a grid of 2 by 2 km tiles to the test area. These “evaluation areas“ are then sub-divided into 16 smaller tiles. In order to ensure the stastistical relevance of the results, P3 demands a minimum number of users and measurement data per tile. These depend on the number of operators in a country and the total number of their customers. If one contender does not meet these requirements in a certain tile, this tile will not be considered for any of the operators for the sake of fairness.
Even if the smartphone displays the availability of voice and data services in an evaluation area, this does not automatically mean that these services can actually be used. Therefore, P3 additionally determines the “quality of coverage“. It indicated, how often users could have actually used the required network service.
Data speed
P3 also investigates the highest download speed that was reached by each participating users per evaluation area during the examined period. For these values, the average is calculated. Additionally, we specify the “P90 values“ – the threshold within a statistical distribution under which 90 per cent of the measurement values range. This indicates the network performance over all evaluation areas and also all users under favourable conditions.
Service availabilty
Another aspect determined in the crowdsourcing are outages of degradations of the (data) network connectivity. A sophisticated algorithm distinguishes simple loss of network coverage (such as in elevators, car parks or indoors) from actual degradations. Incidents that occur at night between 0 am and 6 am are not considered. In contrast to the other crowd results, the service availability considers a seven month period – here from May to November 2018.
Points are deducted for the number of days and the number of hours with service degradations.

Professional and critical: Bernd Theiss, head of test and technology at connect (on the left), and Hakan Ekmen, managing director of P3 communications (on the right).

Boxes mounted to the rear and side windows of the cars contain the smartphones used for testing.

Each drivetest vehicle carried six Samsung Galaxy S8 smartphones.

Participate in our crowdsourcing

The connect app not only allows you to take part in our crowdsourcing. Above that, you receive latest telecommunications news and you can also check the speed of your network with an informative speed test. The Android version additionally reveals interesting details like data consumption and usage time per app.
Only if you agree, the app will also perform completely anonymous connection tests in the background. The required data is less than 2 MB per month.
You will find the Android version on the Google Play Store here.
And the iOS version is available on the Apple App Store here.
Fairness and transparency
connect and P3 ensure maximum fairness and transparency.
Part of our standard to ensure fully fair and transparent testing is to inform the operators early about the basic parameters. This so-called framework consists of the smartphones used for testing, the considered KPIs, the basic scoring scheme as well as of the exact timing. connect and P3 defined these frame conditions early in 2018 and subsequently informed the CTOs of the operators about them.
We are open for feedback and suggestions, critically checking every single one. If we regard them as being justified, we then adapt the procedures for all candidates. However, once again we had to decline some suggestions, as we concluded that some operators just wanted to enforce measurement methods which would be advantageous to their own networks only. However, the often intense discussions prove that all involved operators take our methodology as well as our results very seriously.
Another aspect of our strive for transparency is additionally to document and publish any suspicious incidents that were noticed during the tests.
Early during the data gathering for our crowdsourcing, we noticed very big downloads that occured at very regular intervals all over Switzerland, originating from a small two-figure number of participating smartphones. These samples would have had the potential to drive up the evaluation of concerned network operators. Detailled analyses showed that comparable patterns could not be observed in any other country researched by P3.
It remained unclear whether this unusual activity aimed at discrediting the renowned network test of connect and P3, whether a third party might have pursued a disqualification of affected contenders or if it was an attempt to yield improvements in the assessment. It was not possible to identify the originator due to the anonymous data collection. Therefore, connect decided against a disqualification. However, we filtered all suspicious crowdsourcing participants before the evaluation. The editorial staff informed all operators about this step on November 23, 2018. After this date, unusual patterns emerged again – this time from a small number of new participating smartphones. We excluded them from the evaluation as well.
For readers of the German version of this test, published in the printed connect edition or on www.connect.de, we include a German translation of the above information here:
fairness und transparenz
connect und P3 gewährleisten maximale Fairness und Transparenz.
Zu unserem Anspruch, maximal fair und transparent zu testen, gehört auch, die Netzbetreiber frühzeitig über die Rahmenbedingungen des Tests zu informieren. Zu diesem „Framework“ zählen etwa die für den Test eingesetzten Smartphones, die erfassten Parameter, das grundsätzliche Bewertungsschema sowie der exakte Zeitplan. Diese Rahmendaten legten connect und P3 für den vorliegenden Test früh im Jahr 2018 fest und informierten dann die Technikchefs der Netzbetreiber darüber.
Für Rückmeldungen und Vorschläge der Anbieter sind wir dabei offen, prüfen sie jedoch kritisch. Sind sie berechtigt, passen wir das Procedere für alle Testkandidaten gleichermaßen an. Allerdings mussten wir auch diesmal manche Vorschläge ablehnen, weil wir zum Schluss kamen, dass einzelne Anbieter damit nur für ihr eigenes Netz vorteilhafte Messmethoden durchsetzen wollten. Die oft intensiven Diskussionen belegen, dass alle beteiligten Netzbetreiber sowohl unsere Methodik als auch unsere Ergebnisse sehr ernst nehmen.
Zu unserem Anspruch an Transparenz zählt überdies, jedwede während des Tests entdeckte Auffälligkeiten durch Veröffentlichung zu dokumentieren.
Bereits im Lauf der Datenerfassung für das Crowdsourcing fiel auf, dass von einer geringen zweistelligen Anzahl teilnehmender Smartphones sehr große Downloads, sehr regelmäßig und breit gefächert über die gesamte Schweiz durchgeführt wurden. Diese Samples hatten das Potenzial, die Bewertungen betroffener Netzbetreiber nach oben zu treiben. Genaue Analysen zeigten, dass vergleichbare Muster in keinem anderen von P3 analysierten Land auftreten.
Unklar blieb, ob dieses ungewöhnliche Treiben das Ziel hatte, den renommierten Netztest von connect und P3 zu diskreditieren, ob eventuell eine dritte Seite eine Disqualifikation betroffener Betreiber herbeiführen wollte oder ob auf diese Weise eine höhe Bewertung erreicht werden sollte. Den Urheber gezielt zu ermitteln, war wegen der Anonymität der Datenerhebung nicht möglich. connect hat sich deshalb gegen eine Disqualifikation entschieden. Es wurden aber vor der Auswertung alle unter Manipulationsverdacht stehenden Crowdsourcing-Teilnehmer aus dem Datenpool ausgefiltert. Über diesen Schritt hat die Redaktion die Netzbetreiber am 23.11.2018 informiert. Nach diesem Termin traten – dann bei einigen neuen teilnehmenden Smartphones – wieder absolut außergewöhnliche Muster auf. Auch diese haben wir vor der Bewertung ausgefiltert.

Hannes Rügheimer, connect author
conclusion
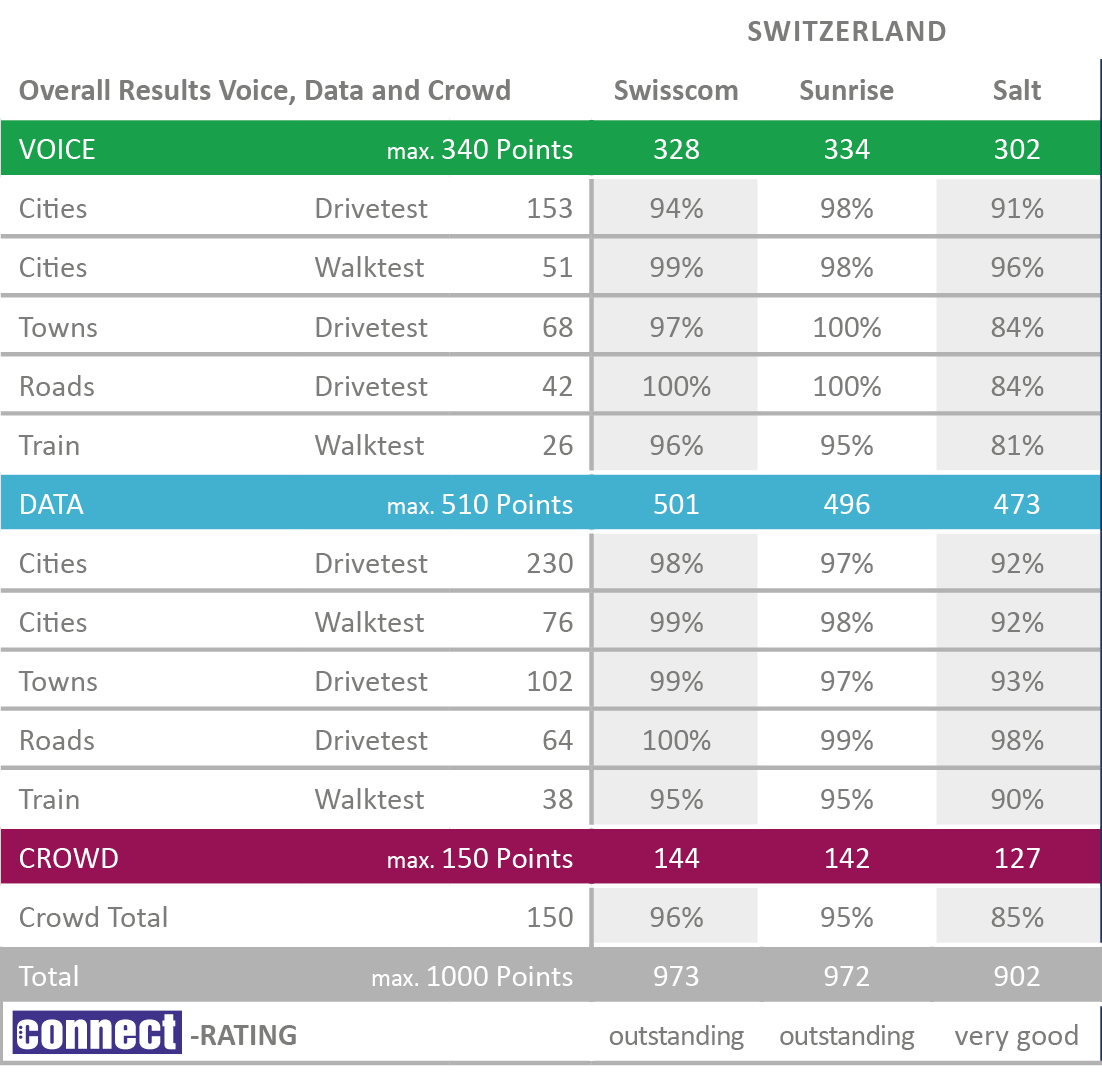
As it has been usual in Switzerland for years, there was a neck-and-neck race between the two extremely strong contenders Swisscom and Sunrise, taking place on the highest level. This time, the race ends with a photo finish. After we had seen a tie of the two rivals in the prevoius year, this time, Swisscom manages to win back the crown with a close margin in the data and crowdsourcing disciplines.
Sunrise also shows outstanding results and furthermore turns out to be the strongest operator in the voice discipline. The smallest Swiss operator, Salt, also makes an excellent impression, presenting significant improvements over last year‘s results both in the voice and data tests. The very good performance of the Swiss providers on the trains will make German mobile customers cry – particularly as all three Swiss candidates have improved again in this discipline compared to the previous year.


All values have been rounded to integer numbers. The internal calculation of points and percentages was based on three decimal places. Intermediate results therefore can slightly deviate from the specified values.